
| TO: | Brigadier General Strock | COE-NPD |
| William Branch | COE - Water Management | |
| Cindy Henriksen | COE-RCC | |
| Doug Arndt | COE-P | |
| Col. Randall J. Butler | COE - Portland District | |
| Lieut. Col. W. E. Bulen, Jr. | COE - Walla Walla District | |
| J. William McDonald | USBR-Boise Regional Director | |
| Steven Wright | Acting BPA-Administrator | |
| Greg Delwiche | BPA-PG-5 | |
| FROM: |
 Christine Mallette |
|
| DATE: | July 3, 2001 | |
| SUBJECT: | Dworshak Operations | |
SPECIFICATIONS:
Beginning July 9 and continuing through at least August 31, 2001, release 10 Kcfs daily at Dworshak, as long as the decision by the Federal Executive Group to not provide summer spill is in effect. Maintain temperature regulation at 48°F.
JUSTIFICATION:
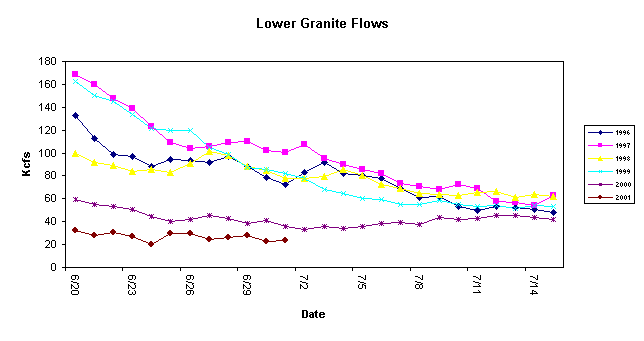
Research conducted by both National Marine Fisheries Service and the US Fish and Wildlife Service has concluded that flow augmentation from Dworshak Reservoir provides a significant survival benefit to juvenile migrating subyearling chinook salmon. This benefit accrues from both a reduction in the water temperature in Lower Granite Reservoir and an increase in flow. The temperature at the Lower Granite forebay monitor is indicating a daily average temperature of 68.9° F, with hourly readings as high as 73°F, increasing as anticipated based on weather conditions. Water quality modeling conducted by both the EPA and U.S. Army Corps of Engineers has shown releases of cool water from Dworshak Reservoir can cool the water temperature in Lower Granite Reservoir. In addition, flows at Lower Granite are far below the flow targets contained in the 2000 Biological Opinion. The following graph shows flows this year compared to the past five years. As seen in the graph the flows are considerably less than normally occur during this time period in more "near average" to "above average" years. Flows over the past five days averaged approximately 25 Kcfs.

The migration of fall chinook from the lower Snake is well underway. Passage indices of subyearling chinook had shown a steady increase for the past several weeks. However, under the present flow regime the passage indices of subyearling chinook at Lower Granite Dam have steadily decreased over the past several days, a trend not usually observed at this time of the year based on past years' data. Based on this information it is imperative to continue flow augmentation from Dworshak.
| Source: Fish Passage Center | Updated: 7/3/01 10:45 |
| * |
See sampling comments http://www.fpc.org/currentDaily/smpcomments.htm This means that one or more of the sites on this date had an incomplete or biased sample. |
| COMBINED SUBYEARLING CHINOOK | ||||||||||||
| Date | WTB (Coll) |
IMN (Coll) |
GRN (Coll) |
LEW (Coll) |
LGR (INDEX) |
LGS (INDEX) |
LMN (INDEX) |
RIS (INDEX) |
MCN (INDEX) |
JDA (INDEX) |
BO2 (INDEX) |
|
| 06/19/2001 | --- | 0 | --- | --- | 10,880 | 410 | 30 | 53 | 109,060 | 22,270 | 25,293 | |
| 06/20/2001 | * | --- | 0 | --- | 2 | 11,740 | 215 | 12 | 43 | 196,000 | 22,200 | 27,505 |
| 06/21/2001 | * | --- | 0 | --- | 0 | 12,300 | 264 | 68 | 52 | 157,250 | 11,440 | --- |
| 06/22/2001 | * | --- | --- | --- | 1 | 4,940 | 724 | 144 | 51 | 87,281 | 8,150 | 22,667 |
| 06/23/2001 | --- | --- | --- | --- | 12,160 | 1,584 | 60 | 122 | 188,200 | 8,760 | 28,218 | |
| 06/24/2001 | * | --- | --- | --- | --- | 22,080 | 2,180 | 96 | 87 | 292,500 | 26,670 | 19,988 |
| 06/25/2001 | --- | --- | --- | 0 | 7,180 | 610 | 60 | 217 | 500,000 | 35,800 | 18,419 | |
| 06/26/2001 | --- | --- | --- | 1 | 14,940 | 3,137 | 352 | 387 | 448,400 | 15,050 | 14,915 | |
| 06/27/2001 | --- | --- | --- | 0 | 11,940 | 2,151 | 90 | 520 | 491,100 | 54,350 | 23,832 | |
| 06/28/2001 | --- | --- | --- | 0 | 10,240 | 780 | 50 | 246 | 356,800 | 31,500 | 22,039 | |
| 06/29/2001 | --- | --- | --- | 0 | 6,620 | 600 | 84 | 243 | 327,697 | 22,150 | 28,503 | |
| 06/30/2001 | * | --- | --- | --- | --- | 6,800 | 2,556 | 132 | 184 | 525,360 | 65,250 | 39,645 |
| 07/01/2001 | --- | --- | --- | --- | 4,140 | 1,485 | 196 | 200 | 665,200 | 28,100 | 19,842 | |
| 07/02/2001 | --- | --- | --- | --- | 4,860 | 955 | 64 | 128 | 440,900 | 11,970 | 18,633 | |
| 07/03/2001 | --- | --- | --- | --- | --- | --- | --- | --- | --- | --- | --- | |
| Total: | 0 | 0 | 0 | 4 | 140,820 | 17,651 | 1,438 | 2,533 | 4,785,748 | 363,660 | 309,499 | |
| # Days: | 0 | 3 | 0 | 8 | 14 | 14 | 14 | 14 | 14 | 14 | 13 | |
| Average: | 0 | 0 | 0 | 1 | 10,059 | 1,261 | 103 | 181 | 341,839 | 25,976 | 23,808 | |
| YTD | 1 | 1 | 13 | 31 | 337,560 | 22,643 | 9,542 | 4,287 | 5,677,187 | 446,535 | 1,609,637 | |