Christine Mallette, Chairperson, Salmon Managers
| TO: | Brigadier General Strock | COE-NPD |
| William Branch | COE - Water Management | |
| Cindy Henriksen | COE-RCC | |
| Doug Arndt | COE-P | |
| Col. Randall J. Butler | COE - Portland District | |
| Lieut. Col. W. E. Bulen, Jr. | COE - Walla Walla District | |
| J. William McDonald | USBR-Boise Regional Director | |
| Steven Wright | Acting BPA-Administrator | |
| Greg Delwiche | BPA-PG-5 | |
| FROM: |
Christine Mallette, Chairperson, Salmon Managers |
|
| DATE: | July 10, 2001 | |
| SUBJECT: | Grand Coulee Operations | |
| SPECIFICATIONS: | Between now and July 22, discontinue refill and pass inflow from Grand Coulee, plus the additional volume of water stored between elevation 1280 feet and the present elevation of 1283.8 feet, to reach an elevation of 1280 feet by July 22. Based on the inflows projected in the SSARR dated July 9, 2001 and the projected additional volume of 147.8 KSFD now in the reservoir, we estimate an average outflow from Grand Coulee of 72.4 Kcfs during this time period. | |
JUSTIFICATION:
The historic passage dates for the majority of the chinook subyearling migration at McNary Dam are late June to late July. We are presently within this migration period. Entering this critical passage period flows at McNary Dam have decreased dramatically over this past week, averaging only 83.34 Kcfs for the past five days, in comparison to the 200 Kcfs flow target contained in the 2000 Biological Opinion. Along with the drop in flow, this same time period has been characterized by a precipitous decline in the passage indices of subyearling fall chinook (see table).
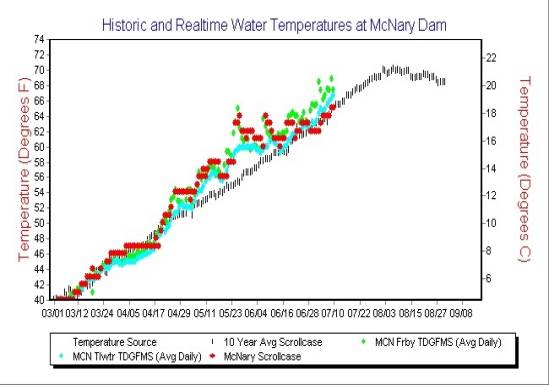
At the same time that flows have dropped, the temperatures at McNary Dam have increased considerably over the past few days (see attached graph). If flows are not increased, a greater percentage of the migration will be subjected to higher temperatures and suffer additional mortality. While transportation is being maximized at McNary Dam, the collection efficiencies still leave a considerable portion of the migration in the lower River. At these extreme low flows the travel time through this reach will be extended. The requested operation results in flows at McNary Dam that are on average about 12 Kcfs greater than the current planned operation. If allowed to continue, the operation depicted by the July 9 SSARR shows a continued refill of Grand to an elevation of 1286.1 feet on July 16 with releases from Grand Coulee as low as 30 Kcfs, and then an increase in flows subsequent to this date. This operation is not consistent with the needs of the fish migration, during what should be their peak passage period.
| Source: Fish Passage Center | Updated: 7/10/01 11:38 |
| * |
See sampling comments http://www.fpc.org/currentDaily/smpcomments.htm This means that one or more of the sites on this date had an incomplete or biased sample. |
| COMBINED SUBYEARLING CHINOOK | ||||||||||||
| Date | WTB (Coll) |
IMN (Coll) |
GRN (Coll) |
LEW (Coll) |
LGR (INDEX) |
LGS (INDEX) |
LMN (INDEX) |
RIS (INDEX) |
MCN (INDEX) |
JDA (INDEX) |
BO2 (INDEX) |
|
| 06/26/2001 | --- | --- | --- | 1 | 14,940 | 3,137 | 352 | 387 | 448,400 | 15,050 | 14,915 | |
| 06/27/2001 | --- | --- | --- | 0 | 11,940 | 2,151 | 90 | 520 | 491,100 | 54,350 | 23,832 | |
| 06/28/2001 | --- | --- | --- | 0 | 10,240 | 780 | 50 | 246 | 356,800 | 31,500 | 22,039 | |
| 06/29/2001 | --- | --- | --- | 0 | 6,620 | 600 | 84 | 243 | 327,697 | 22,150 | 28,503 | |
| 06/30/2001 | * | --- | --- | --- | --- | 6,800 | 2,556 | 132 | 184 | 525,360 | 65,250 | 39,645 |
| 07/01/2001 | --- | --- | --- | --- | 4,140 | 1,485 | 196 | 200 | 665,200 | 28,100 | 19,842 | |
| 07/02/2001 | --- | --- | --- | --- | 4,860 | 955 | 64 | 128 | 440,900 | 11,970 | 18,633 | |
| 07/03/2001 | --- | --- | --- | --- | 9,260 | 886 | 136 | 310 | 588,100 | 41,970 | 31,198 | |
| 07/04/2001 | --- | --- | --- | --- | 82,200 | 5,795 | 416 | 209 | 435,800 | 79,590 | 31,721 | |
| 07/05/2001 | --- | --- | --- | --- | 46,200 | 7,381 | 500 | 110 | 214,600 | 55,900 | 20,060 | |
| 07/06/2001 | * | --- | --- | --- | --- | 9,700 | 15,560 | 300 | 218 | 139,898 | 23,850 | 25,095 |
| 07/07/2001 | --- | --- | --- | --- | 27,740 | 11,412 | 370 | 297 | 82,000 | 11,500 | 37,645 | |
| 07/08/2001 | --- | --- | --- | --- | 26,300 | 5,907 | 560 | 136 | 46,500 | 15,658 | 38,878 | |
| 07/09/2001 | --- | --- | --- | --- | 17,720 | 3,558 | 1,110 | 641 | 17,490 | 7,260 | 67,359 | |
| 07/10/2001 | --- | --- | --- | --- | --- | --- | --- | --- | 28,884 | 16,866 | 26,051 | |
| Total: | 0 | 0 | 0 | 1 | 278,660 | 62,163 | 4,360 | 3,829 | 4,808,729 | 480,964 | 445,416 | |
| # Days: | 0 | 0 | 0 | 4 | 14 | 14 | 14 | 14 | 15 | 15 | 15 | |
| Average: | 0 | 0 | 0 | 0 | 19,904 | 4,440 | 311 | 274 | 320,582 | 32,064 | 29,694 | |
| YTD | 1 | 1 | 13 | 31 | 556,680 | 73,125 | 12,934 | 6,208 | 7,230,459 | 699,129 | 1,887,644 | |